
[How to] Draw arrows on the map with Tableau !

Introduction
I don’t like writing intros. No one reads them anyway. Let me just say that today I will show you one of the ways you can draw arrows on the map, which I used for one of my personal projects, and which may be useful for you too. At the end of this tutorial, you will be able to make charts like this:
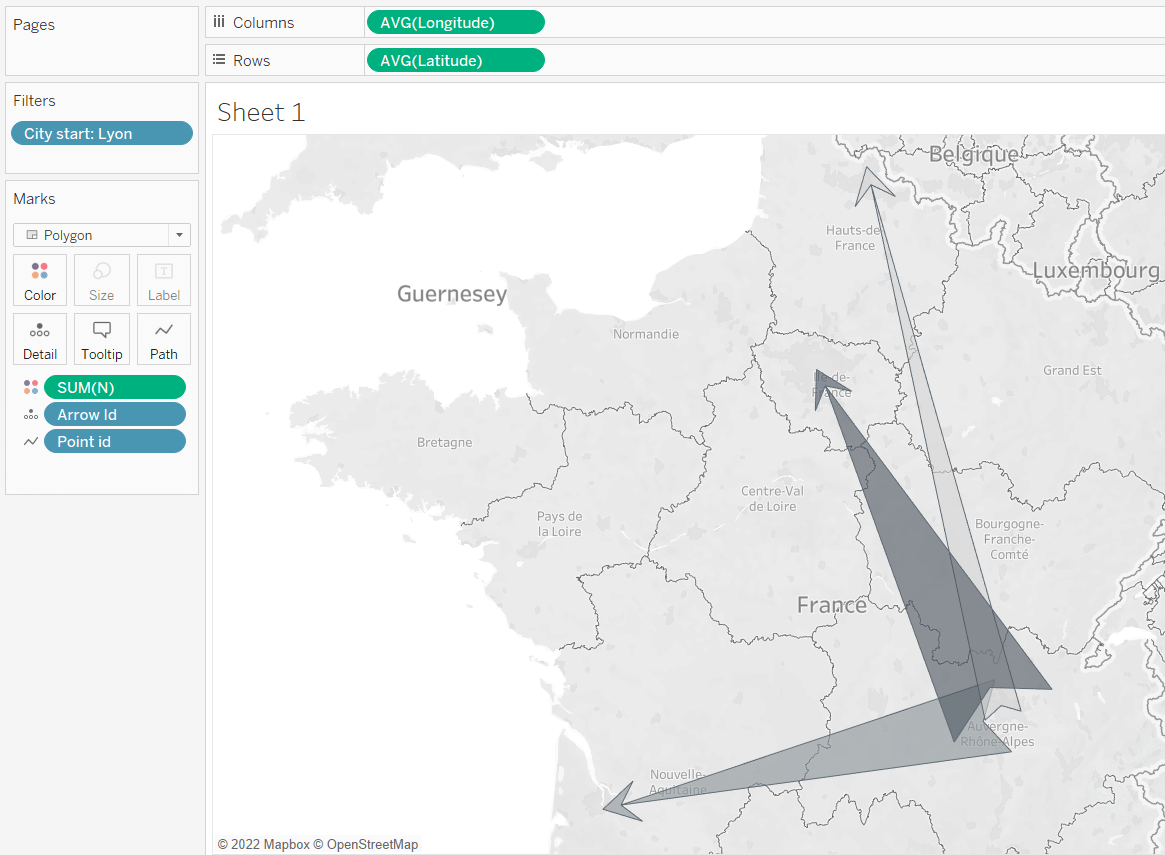
Let’s first talk out what we are going to do and the logic behind. Because if you understand that you can customize your arrows up to your taste (yes, I am not going to claim that my arrows are the most beautiful, although they most certainly are).
1. Polygons !
Polygons require ordered, enclosed sets of X, Y coordinates. This does mean that:
- Each arrow will have its own unique ID
- Each point of each arrow will have its own unique ID
- These IDs will indicate in what order the line will be drawn through these points.
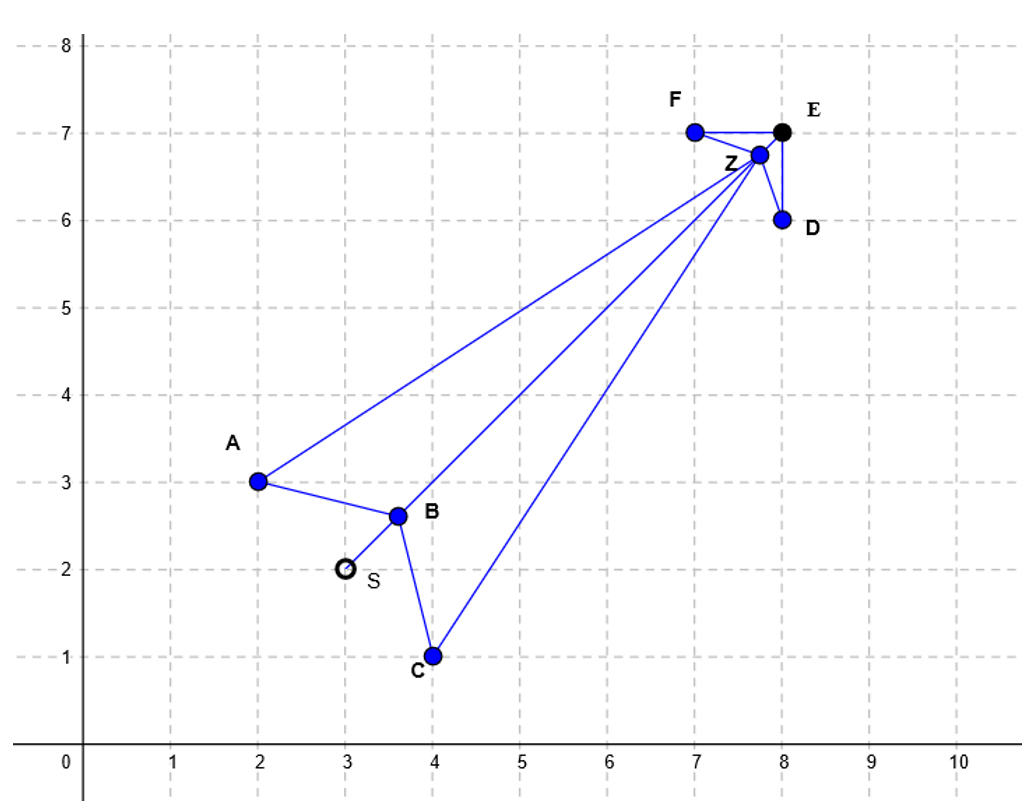
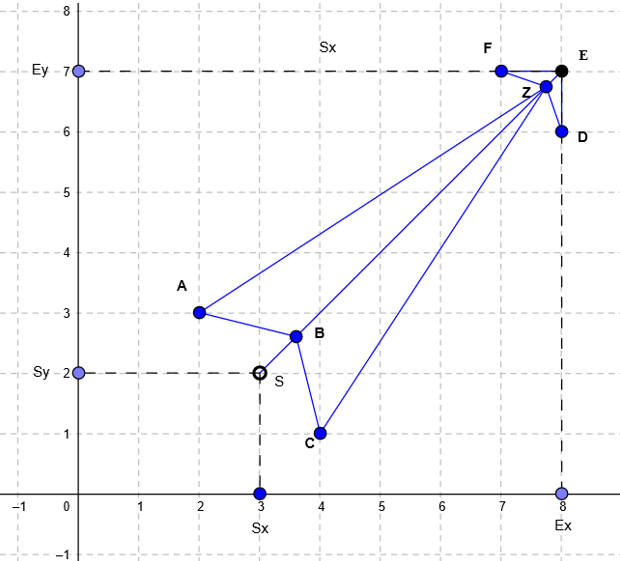
This is our arrow skeleton.
You can see 8 points here (the order matters!): A, B, C, Z, D, E, F, Z.
You may have noticed we have two Z here: for this kind of arrow, you need to have one value twice, otherwise your points will not be connected correctly. The last point will be connected with the first one automatically. Here, E is the end point and S is the start point in our data set.
We will need the following data source structure:
| Arrow id | Point id | X | Y |
| 1 | 1 | (A1x coordinate) | (A1y coordinate) |
| 1 | 2 | (B1x coordinate) | (B1y coordinate) |
| 1 | 3 | (C1x coordinate) | (C1y coordinate) |
| 1 | 4 | (Z1x coordinate) | (Z1y coordinate) |
| 1 | 5 | (D1x coordinate) | (D1y coordinate) |
| 1 | 6 | (E1x coordinate) | (E1y coordinate) |
| 1 | 7 | (F1x coordinate) | (F1y coordinate) |
| 1 | 8 | (Z1x coordinate) | (Z1y coordinate) |
| 2 | 1 | (A2x coordinate) | (A2y coordinate) |
| 2 | 2 | (B2x coordinate) | (B2y coordinate) |
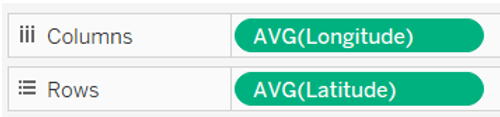
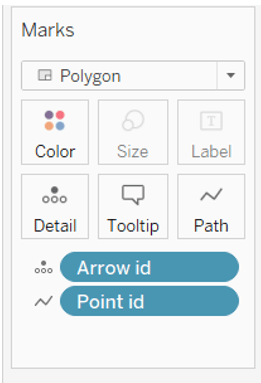
We will put Longitude in Columns, Latitude in Rows, choose Polygon as your type of chart, drag and drop Arrow id in Detail and Point id in Path.
2. Trigonomety :
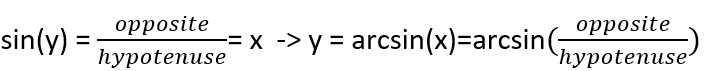
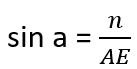
To calculate coordinates, we will use the Pythagorean theorem and the following trigonometric formula:
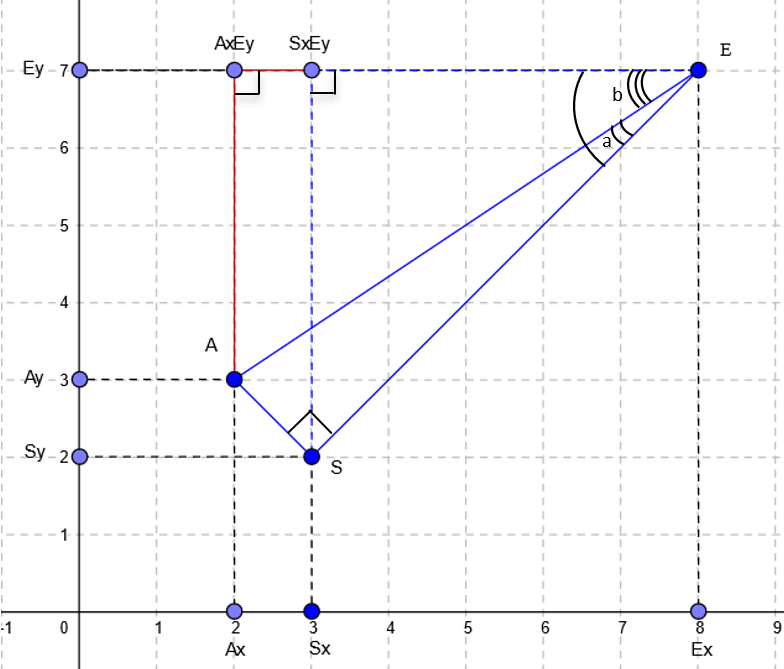
On the example of the A point I will show you how to find all the coordinates, knowing the coordinates of S point (start point) and E point (end point) as well as desired length of AS (n).
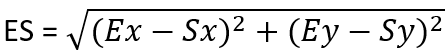
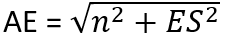
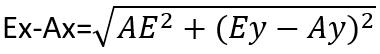
We can calculate Ex-Sx and Ey-Sy since we know all the necessary coordinates. Thanks to that we can also calculate the length of ES and AE:
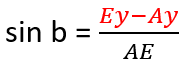
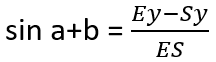
We can find Ey-Ay and Ex-Ax:
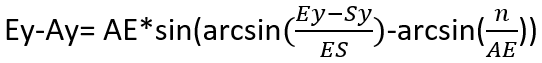
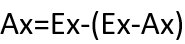
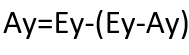
Then to find Ax you just need to subtract the value of Ex-Ax from the value of Ex. Same logic applies for Ay:
If you want to customize your arrow, just draw it differently on your canvas and calculate the coordinates using the same logic.
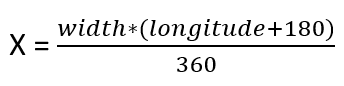
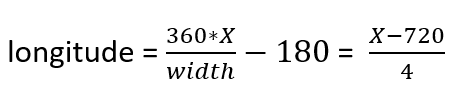
3. Longitude-latitude -> X-Y
- It’s also important to understand that longitude-latitude cannot be used for the 2D calculations as they are. First, we need to transform them in X-Y coordinates, then make all the calculations to find X-Y coordinates for all the points and finally transform them in longitude-latitude values.
This article explains the logic behind the calculations I used in my workbook.
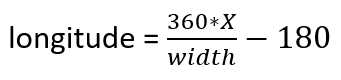
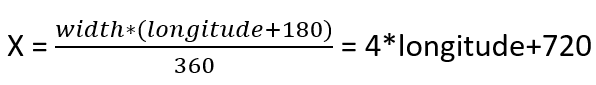
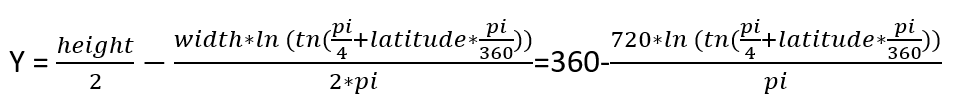
Here are the formulas we are going to use:
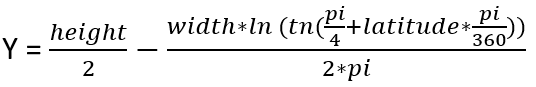
And reversed:
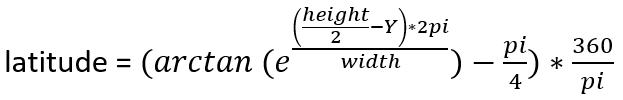
I used 1440 pixels as width value and 720 pixels as height value. I believe it doesn’t really matter what to choose since we will convert the coordinates back to longitude-latitude values.
Creating a dataset
Now it’s time to start. I will take longitude-latitude of 4 French cities and create arrows between them.
| City | Latitude | Longitude |
| Paris | 48.85499357107459 | 2.3346734272193794 |
| Lille | 50.62374591673762 | 3.0110800296755196 |
| Lyon | 45.68554335428289 | 4.853667452230858 |
| Bordeaux | 44.79603794403178 | -0.547927769672152 |
To do so, in my dataset I create all the possible pairs of these cities. Per each pair I will also define a randomly chosen n, that will define the thickness of the arrows. Here is what I’ve got:
| City start | Start Latitude | Start Longitude | City end | End Latitude | End Longitude | n | arrow id | 0 |
| Paris | 48.85499357107459 | 2.3346734272193794 | Lille | 50.62374591673762 | 3.0110800296755196 | 3 | 1 | 0 |
| Paris | 48.85499357107459 | 2.3346734272193794 | Lyon | 45.68554335428289 | 4.853667452230858 | 2 | 2 | 0 |
| Paris | 48.85499357107459 | 2.3346734272193794 | Bordeaux | 44.79603794403178 | -0.547927769672152 | 1 | 3 | 0 |
| Lille | 50.62374591673762 | 3.0110800296755196 | Paris | 48.85499357107459 | 2.3346734272193794 | 3 | 4 | 0 |
| Lille | 50.62374591673762 | 3.0110800296755196 | Lyon | 45.68554335428289 | 4.853667452230858 | 2 | 5 | 0 |
| Lille | 50.62374591673762 | 3.0110800296755196 | Bordeaux | 44.79603794403178 | -0.547927769672152 | 2 | 6 | 0 |
| Lyon | 45.68554335428289 | 4.853667452230858 | Paris | 48.85499357107459 | 2.3346734272193794 | 3 | 7 | 0 |
| Lyon | 45.68554335428289 | 4.853667452230858 | Lille | 50.62374591673762 | 3.0110800296755196 | 1 | 8 | 0 |
| Lyon | 45.68554335428289 | 4.853667452230858 | Bordeaux | 44.79603794403178 | -0.547927769672152 | 2 | 9 | 0 |
| Bordeaux | 44.79603794403178 | -0.547927769672152 | Paris | 48.85499357107459 | 2.3346734272193794 | 3 | 10 | 0 |
| Bordeaux | 44.79603794403178 | -0.547927769672152 | Lille | 50.62374591673762 | 3.0110800296755196 | 1 | 11 | 0 |
| Bordeaux | 44.79603794403178 | -0.547927769672152 | Lyon | 45.68554335428289 | 4.853667452230858 | 2 | 12 | 0 |
Arrow id is a unique number per city start – city end pair. 0 column will be used to create a cartesian product with the second table. Remember, we need to have 8 lines per each row to draw our 8 points.
The second table looks like that:
| 0 | Point id |
| 0 | 1 |
| 0 | 2 |
| 0 | 3 |
| 0 | 4 |
| 0 | 5 |
| 0 | 6 |
| 0 | 7 |
| 0 | 8 |
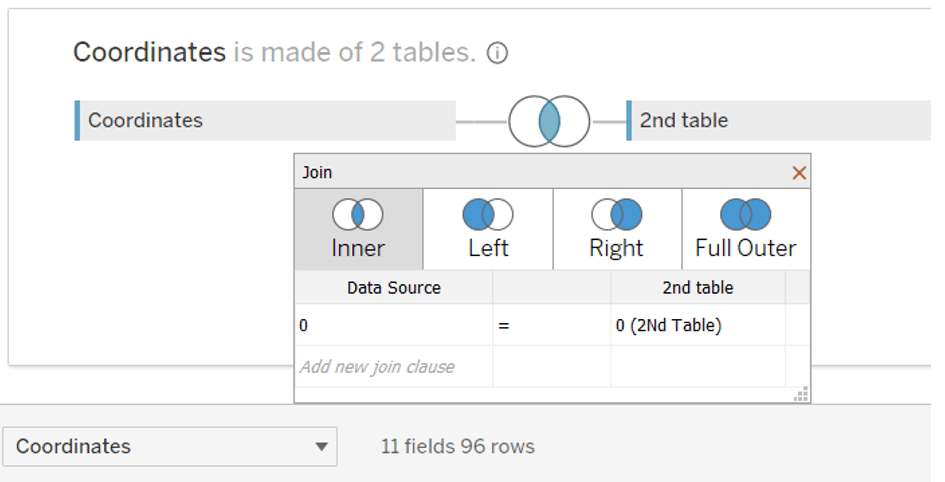
First, we need to create a data source. 12*8 gives us 96 rows:
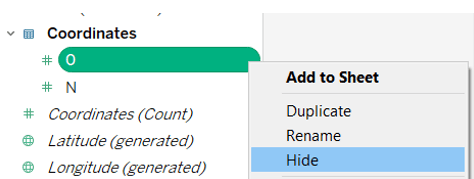
After that you can hide both 0 columns, we won’t need them:
Calculations
Since I chose 1440 pixels as width value and 720 pixels as height, we can already put those values in our formulas:
Now we have everything to compute X-Y coordinates for S and E points:
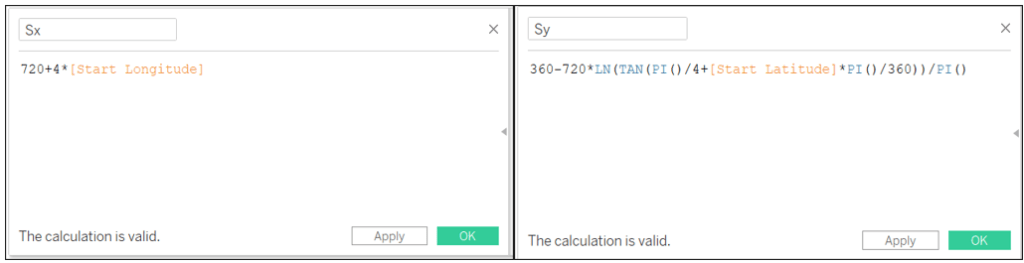
Sx: 720+4*[Start Longitude]
Sy: 360-720*LN(TAN(PI()/4+[Start Latitude]*PI()/360))/PI()
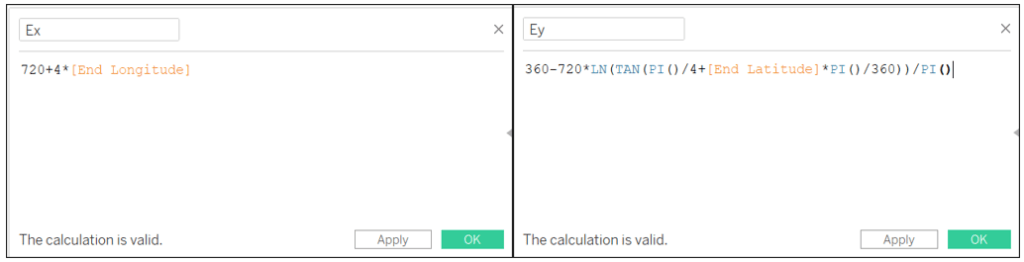
Ex: 720+4*[End Longitude]
Ey: 360-720*LN(TAN(PI()/4+[End Latitude]*PI()/360))/PI()
Next step will be to calculate the distances between Sx and Ex, Sy and Ey, between S and E and A(C) and E.
We use ABS since our arrow can look at any direction and we want to calculate the distance between the points that can’t be negative.
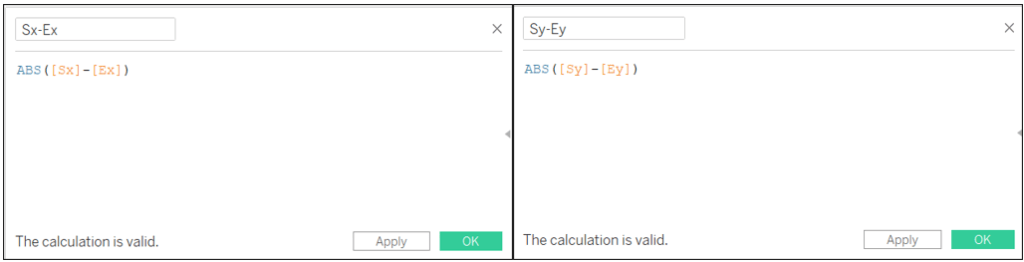
Sx-Ex: ABS([Sx]-[Ex])
Sy-Ey: ABS([Sy]-[Ey])
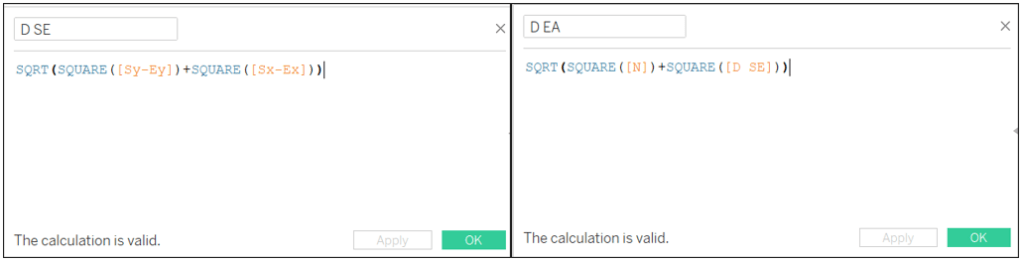
D SE: SQRT(SQUARE([Sy-Ey])+SQUARE([Sx-Ex]))
D EA: SQRT(SQUARE([N])+SQUARE([D SE]))
Now we can start creating our points. We start with the point A. First, we calculate distances Ax-Ey and Ax-Ex:
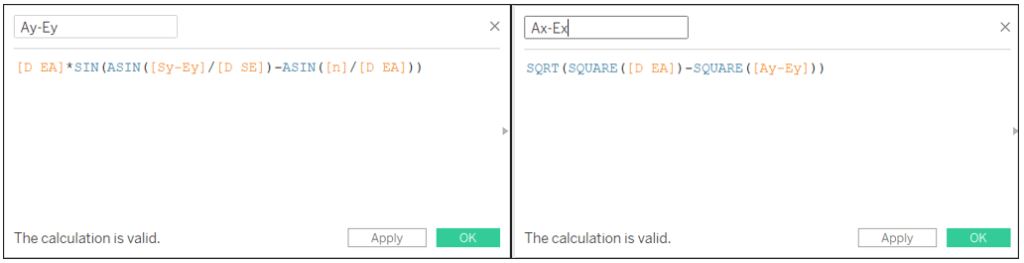
Ay-Ey: [D EA]*SIN(ASIN([Sy-Ey]/[D SE])-ASIN([N]/[D EA]))
Ax-Ex: SQRT(SQUARE([D EA])-SQUARE([Ay-Ey]))
Then depending on the positioning of the end point regarding the start point we will either add the distance value to or subtract it from the coordinates of the end point:
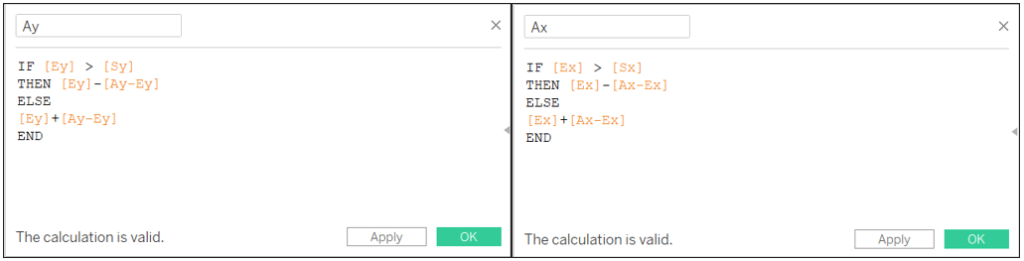
Ay: IF [Ey] > [Sy] THEN [Ey]-[Ay-Ey] ELSE [Ey]+[Ay-Ey] END
Ax: IF [Ex] > [Sx] THEN [Ex]-[Ax-Ex] ELSE [Ex]+[Ax-Ex] END
We do the same procedure for other points.
Cx-Ex: [D EA]*SIN(ASIN([Sx-Ex]/[D SE])-ASIN([N]/[D EA]))
Cy-Ey: SQRT(SQUARE([D EA])-SQUARE([Cx-Ex]))
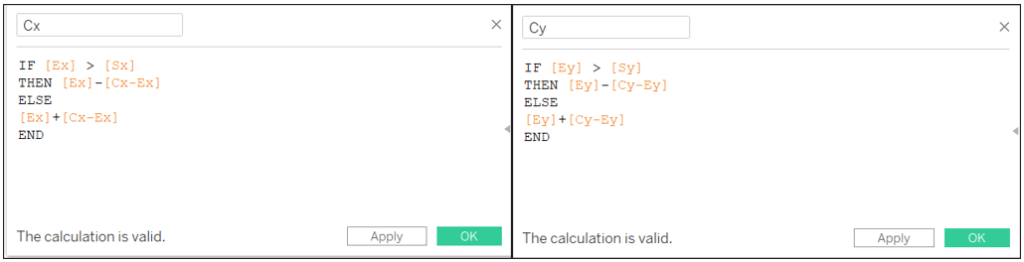
Cx: IF [Ex] > [Sx] THEN [Ex]-[Cx-Ex] ELSE [Ex]+[Cx-Ex] END
Cy: IF [Ey] > [Sy] THEN [Ey]-[Cy-Ey] ELSE [Ey]+[Cy-Ey] END
For the B point I defined SB = n/2. To calculate it I use the distance between Sy and Ay
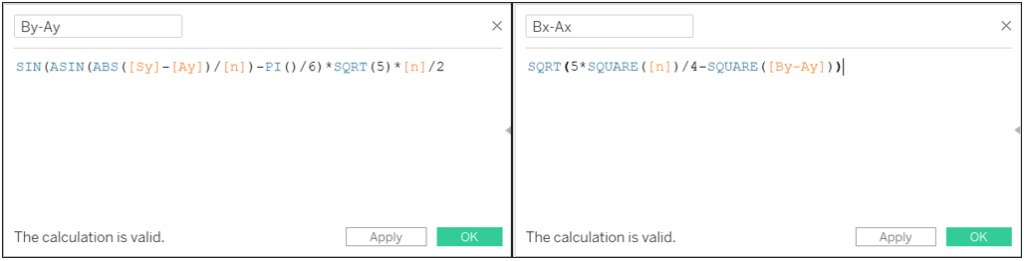
By-Ay: SIN(ASIN(ABS([Sy]-[Ay])/[N])-PI()/6)*SQRT(5)*[N]/2
Bx-Ax: SQRT(5*SQUARE([N])/4-SQUARE([By-Ay]))
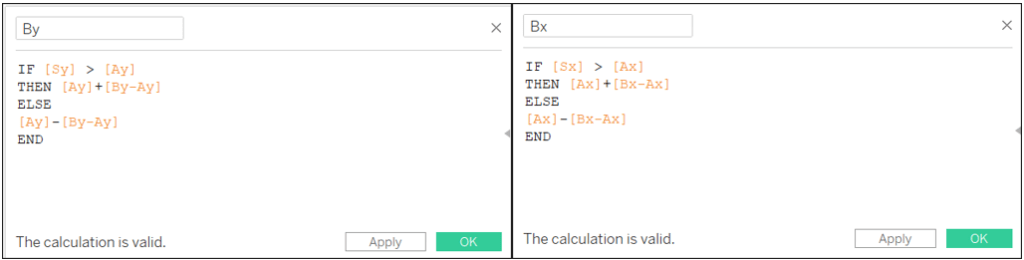
By: IF [Sy] > [Ay] THEN [Ay]+[By-Ay] ELSE [Ay]-[By-Ay] END
Bx: IF [Sx] > [Ax] THEN [Ax]+[Bx-Ax] ELSE [Ax]-[Bx-Ax] END
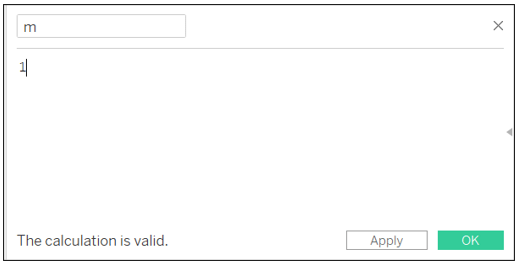
I made Z point depend on a constant m. My m=1
We calculate the coordinates of Z using the proportion D SE / m:
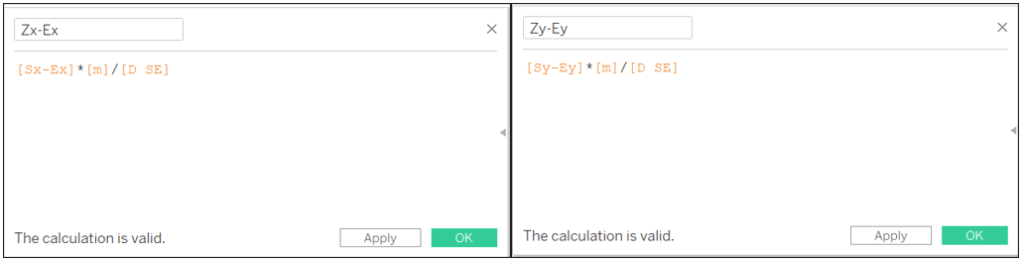
Zx-Ex: [Sx-Ex]*[m]/[D SE]
Zy-Ey: [Sy-Ey]*[m]/[D SE]
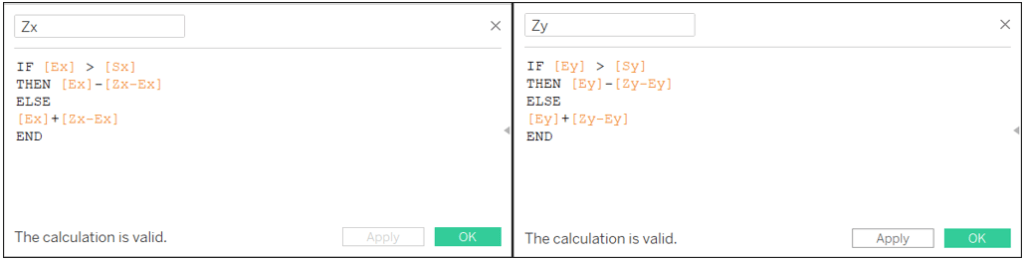
Zx: IF [Ex] > [Sx] THEN [Ex]-[Zx-Ex] ELSE [Ex]+[Zx-Ex] END
Zy: IF [Ey] > [Sy] THEN [Ey]-[Zy-Ey] ELSE [Ey]+[Zy-Ey] END
We have D and F points left.
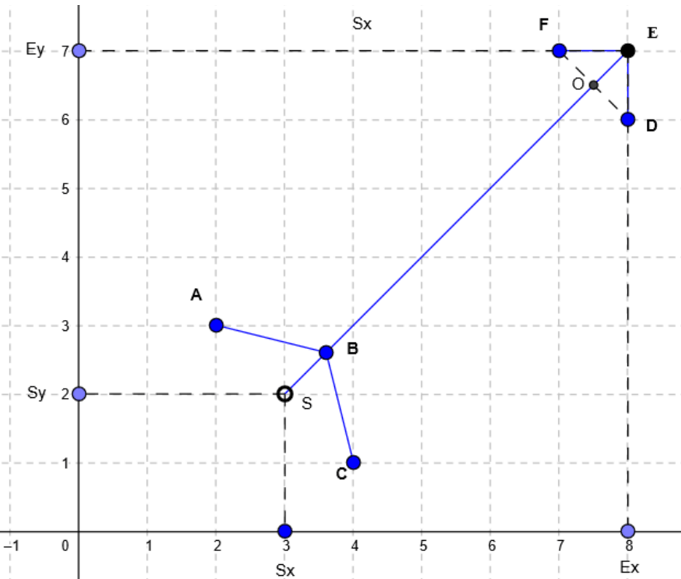
Connecting them we will get the point O on the intersection with the SE line. I defined FO=OD=m=OE/2
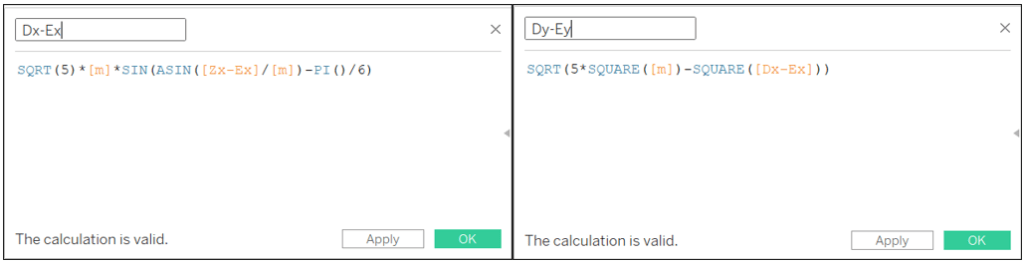
Dx-Ex: SQRT(5)*[m]*SIN(ASIN([Zx-Ex]/[m])-PI()/6)
Dy-Ey: SQRT(5*SQUARE([m])-SQUARE([Dx-Ex]))
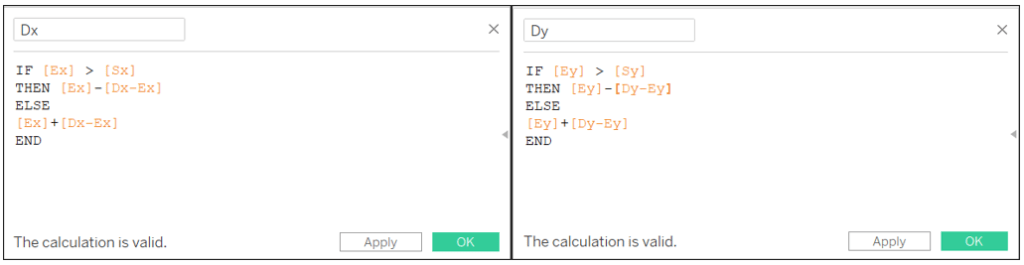
Dx: IF [Ex] > [Sx] THEN [Ex]-[Dx-Ex] ELSE [Ex]+[Dx-Ex] END
Dy: IF [Ey] > [Sy] THEN [Ey]-[Dy-Ey] ELSE [Ey]+[Dy-Ey] END
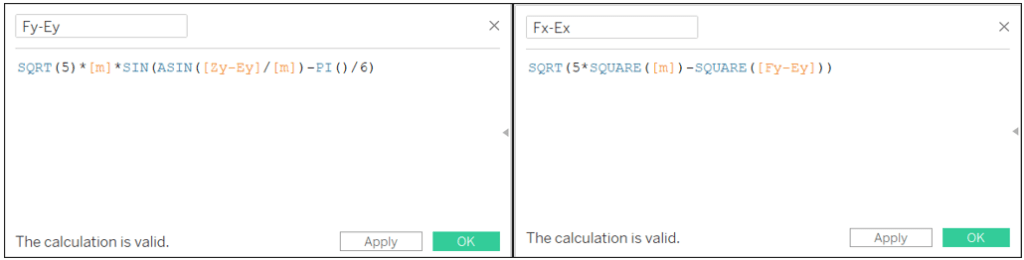
Fy-Ey: SQRT(5)*[m]*SIN(ASIN([Zy-Ey]/[m])-PI()/6)
Fx-Ex: SQRT(5*SQUARE([m])-SQUARE([Fy-Ey]))
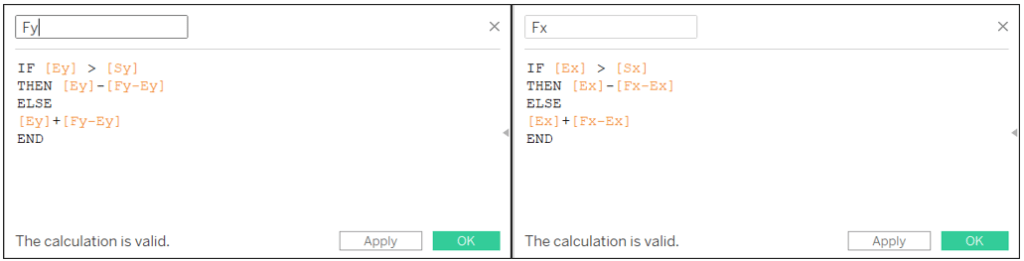
Fy: IF [Ey] > [Sy] THEN [Ey]-[Fy-Ey] ELSE [Ey]+[Fy-Ey] END
Fx: IF [Ex] > [Sx] THEN [Ex]-[Fx-Ex] ELSE [Ex]+[Fx-Ex] END
Now we have all our X-Y coordinates and it’s time to convert them to longitude and longitude values.
Since I chose 1440 pixels as width value and 720 pixels as height, we can already put those values in our formulas:

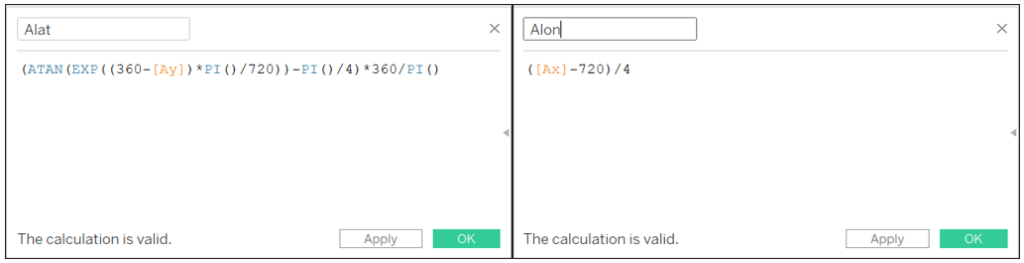
Alat: (ATAN(EXP((360-[Ay])*PI()/720))-PI()/4)*360/PI()
Alon: ([Ax]-720)/4
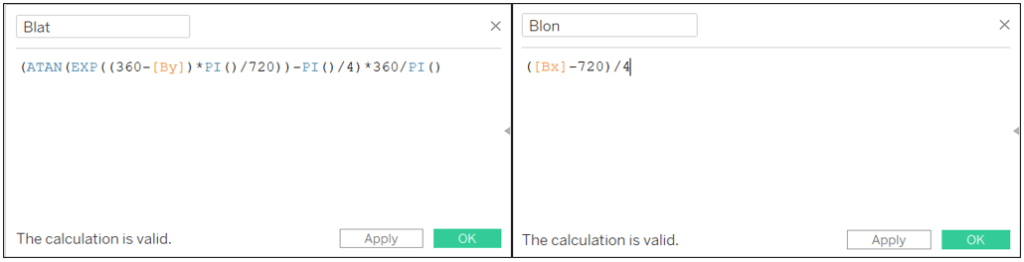
Blat: (ATAN(EXP((360-[By])*PI()/720))-PI()/4)*360/PI()
Blon: ([Bx]-720)/4
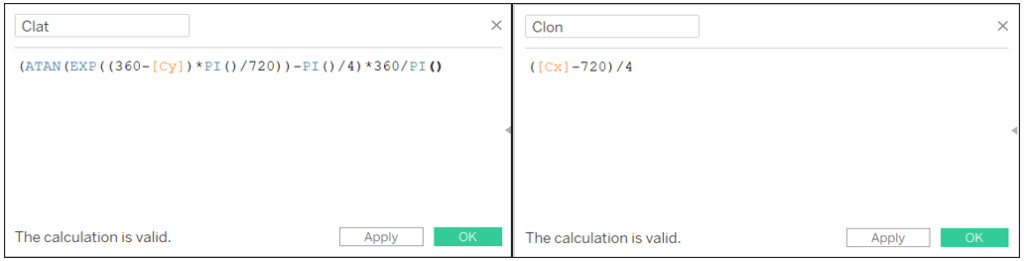
Clat: (ATAN(EXP((360-[Cy])*PI()/720))-PI()/4)*360/PI()
Clon: ([Cx]-720)/4
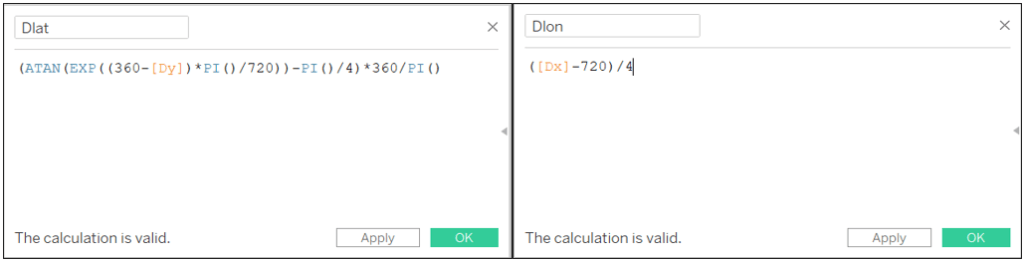
Dlat: (ATAN(EXP((360-[Dy])*PI()/720))-PI()/4)*360/PI()
Dlon: ([Dx]-720)/4
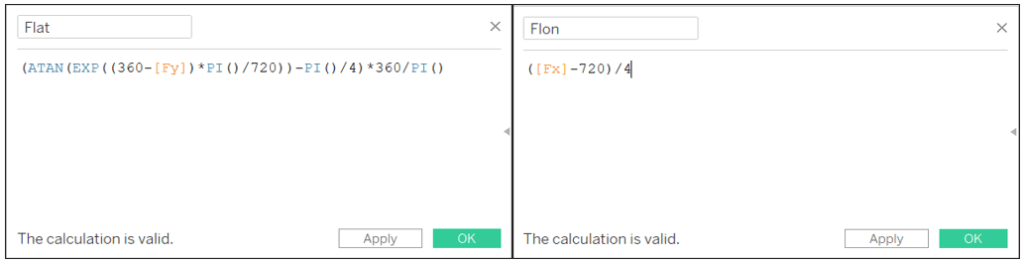
Flat: (ATAN(EXP((360-[Fy])*PI()/720))-PI()/4)*360/PI()
Flon: ([Fx]-720)/4
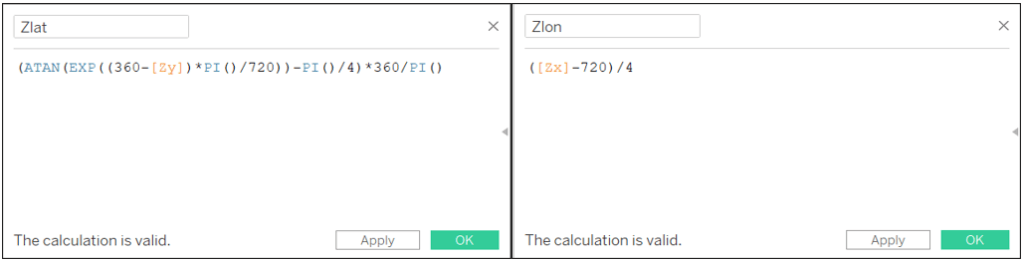
Zlat: (ATAN(EXP((360-[Zy])*PI()/720))-PI()/4)*360/PI()
Zlon: ([Zx]-720)/4
Lastly, we need to create calculated fields to collect all the longitude and latitude values in a correct order.
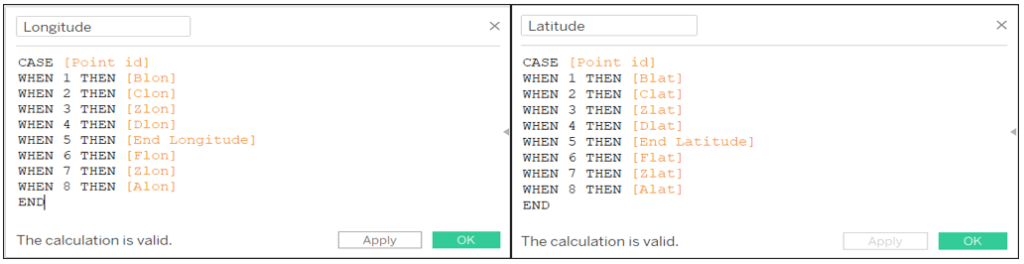
Longitude: CASE [Point id] WHEN 1 THEN [Blon] WHEN 2 THEN [Clon] WHEN 3 THEN [Zlon] WHEN 4 THEN [Dlon] WHEN 5 THEN [End Longitude] WHEN 6 THEN [Flon] WHEN 7 THEN [Zlon] WHEN 8 THEN [Alon] END
Latitude: CASE [Point id] WHEN 1 THEN [Blat] WHEN 2 THEN [Clat] WHEN 3 THEN [Zlat] WHEN 4 THEN [Dlat] WHEN 5 THEN [End Latitude] WHEN 6 THEN [Flat] WHEN 7 THEN [Zlat] WHEN 8 THEN [Alat] END
Creating arrows
We need to change the geographic role for the last two calculated fields:
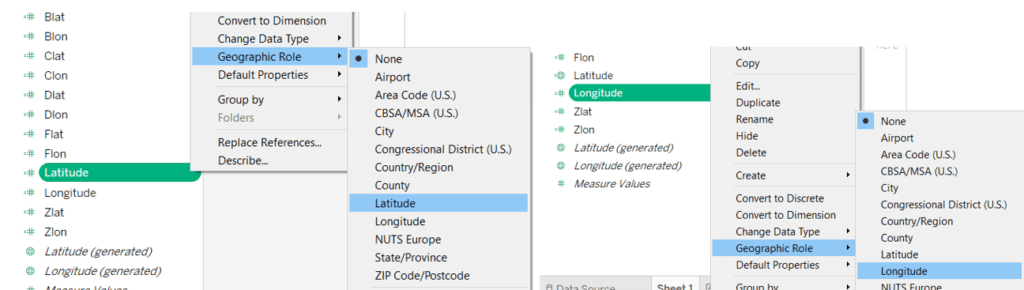
Now choose polygon chart, drag and drop Longitude in Columns, Latitude in Rows, Arrow id in Detail and Point id in Path.
You can also experiment with the colors, opacity, borders, and other features to make your arrows more beautiful.
Result:
Have fun !
Get a free demo of Tableau, the data visualization tool will help you see and undertand your data on one easy-to-use platform !