[Tableau Public] : Europe’s water under pressure (World Water Day 💧)
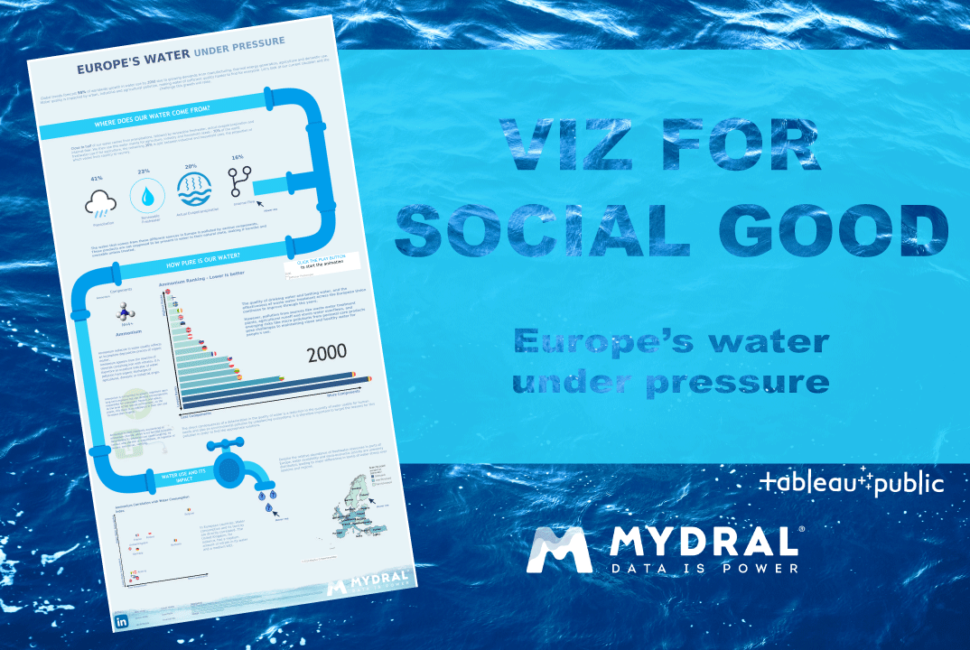
Europe’s water under pressure : have you ever wondered if the water you drink in Europe is safe? Further to World Water Day 2020 (March 22) 💧, which is about water and climate change, Mydral UK experts have created an interactive data vizualisation with useful information on water quality in Europe.
Half of our water is originated from precipiation, renewable freshwater, actual avapotranspiration and Internal flow. This water is mainly used for agriculture, manufacturing and domestic use: 70 % of the world freshwater is for agriculture, the remaining 30% is split between the industrial and the household use, which proportion varies from country to country.
 Where does water comes from in Europe ?
Europe’s water under pressure : water polluted by various components
Ammonium, nitrate, phosphate and phosphorus are not supposed to be detected in water in itheir natural state. Indeed, a high concentration of these products can be very hamrful and unusable unless it is treated. Check by yourself in this interactive viz below : the evolution of the presence of Ammonium in Europe throughout the years.
 Ammonium ranking throughout the years in Europe per country with the lowest rate detected in water. The lower the better 🙂
Europe’s water under pressure : water use varies according to each country
Water avaibility is uneven in Europe. Some countries have more resources compared to the others, leading to major differences in levels of water stress over the seasons and the regions ( depending on the needs in agricuture, manufacturing et household.
We can notice the correlation between water consumption and its toxicity. For instance, Norway, with a low consumption of water is the perfect model for its water quality. On the other hand, Belgium, which water consumption is very high, has the hightest concentration of toxic components in Europe (for all the components).
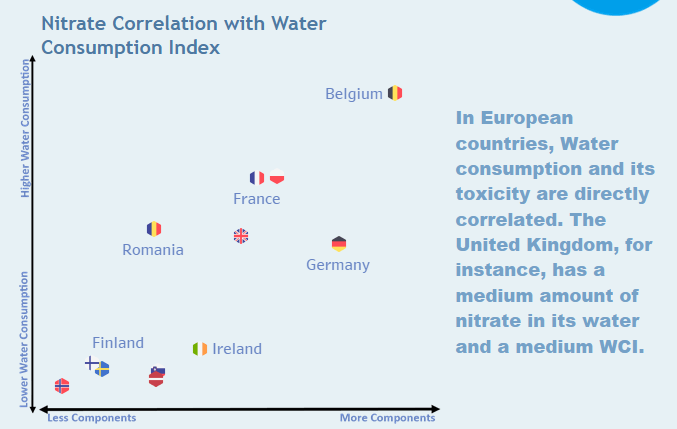 Water consumption in one country and its toxicity (here Nitrate) are intrinsically correlated.
Analyse all the characteritics of water in Europe just below :

Check Mydral UK ‘s best data viz creations in Tableau Public.
Don’t hesitate to leave a comment !
Author Profile