
Data Design – Make your data stunning
Mydral divides its new offer for its clients by Mydral. Discover the steps of a data design project, the data design promise, and a use case.
The term « data design » signifies the art of translating visually our data.
Data Design
It shows first the essential by visual choices of organization and animation. On the other hand, it transcribes data through visual representations and graphics. Finally, it gives access to an intelligent communication by the elaboration of a story that simple its transmission.
Thus, the graphic is a communication tool that serves comprehension. A huge figure of History, Florence Nightingale, has been the first nurse to highlight statistics in the health world. She then managed to save lives by identifying the soldiers’ death causes in hospitals by underlining the importance of the hygienic and the sterilization of the instruments used in the hospitalist surrounding.
We can find underneath, the most important graphic of her carrier, giving the name to that type: la Rose de Nightingale.
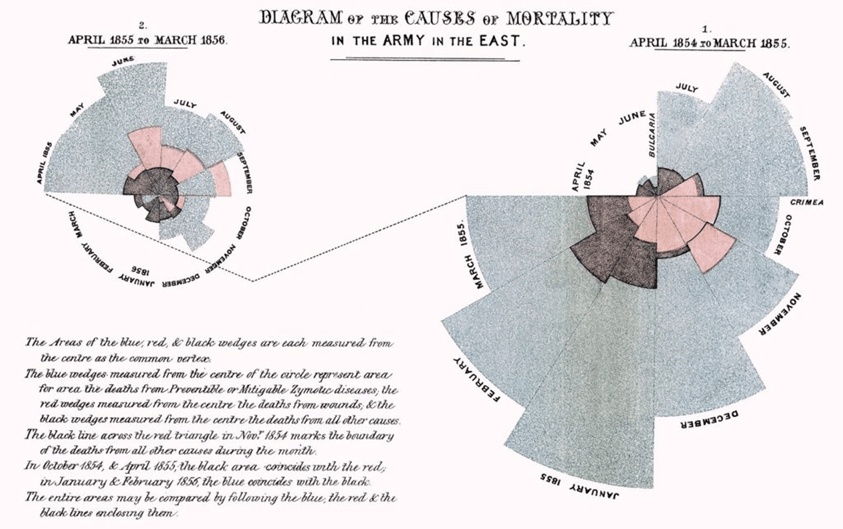
Causes of Death Diagram – Florence Nightingale
Our promises through this offer
Based on research in neurosciences, they proved that decisions were based on emotions and feelings. Thus, we divide it into 3 main parts: values, key numbers, and the alliance between two services.
- Comprehension :
It assures the assimilation of complex information, leading to the implication and user’s adhesion. This is translated by the following statistic: the Human’s brain captures 80% of information by images. It treats visual data faster than numbers of texts.
- Communication :
Diffusion and power of messages that influence our image. A study shows that since the 2000’s, the focusing time changed to 8sec. Context that makes visualization appear as an efficient media to capture attention.
- Decision :
The decision pledge stimulates and accelerates decision making, offering then a huge time saving. In fact, 92,6% of people declare that the visual dimension is the number one influential factor affecting decisions.
- Key numbers:
- 100% of realized project
- 92% of satisfied clients
- 70% of team performances
- 65% of decision making
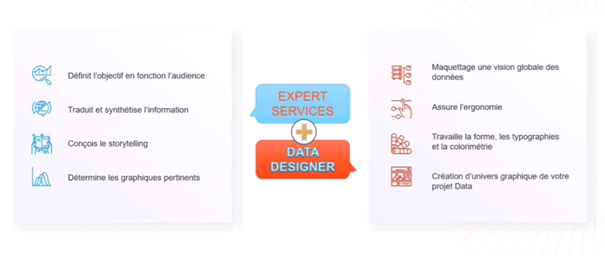
- The union of a Services Expert and a Data Designer :
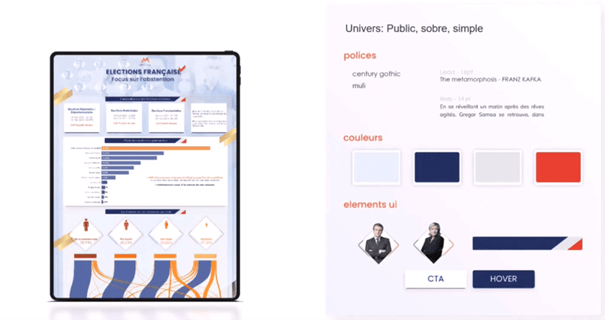
Use case
Here is an example of what we offer. Based on the 2022 presidential election, we implemented a grapic chart strict that represents the chosen theme’s universe. Thus, we can adapt ourselves and give the best answers to your expectations with a visual that will make the difference and will make you stand out against competition.
We offer our expertise in different sectors such as:
- The public sector and the industry
- Finance and Banking
- Sale to public and services
In short, why making a Data Design project ?
To understand data in the best way. To optimise decision making.
We bring a visual coherence assiociated to a graphic chart that represents you.
You can from now on ask your free audit data HERE:
Author Profile
Latest entries
 News17 August 2022« Data driven marketing », what does it stand for?
 News25 July 2022[News] Tableau and Salesforce: CRM Analytics
 News18 July 2022Data Design – Make your data stunning
 How To11 July 2022Combine several Excel sheets on Knime
